vif in PythonBefore discussing about the vif, it is essential to understand first what is multicollinearity in linear regression? The situation of multicollinearity arises when two independent variables have a strong correlation. Whenever we perform exploratory data analysis, the objective is to obtain a significant parameter that affects our target variable. Therefore, correlation is the major step that helps us to understand the linear relationship that exists between two variables. What is Correlation?Correlation measures the scope to which two variables are interdependent. A visual idea of checking what kind of a correlation exists between the two variables. We can plot a graph and interpret how does a rise in the value of one attribute affects the other attribute. Concerning statistics, we can obtain the correlation using Pearson Correlation. It gives us the correlation coefficient and the P-value. Let us have a look at the criteria-
Since now we have a detailed idea of correlation, we now understood that if a strong correlation exists between two independent variables of a dataset, it leads to multicollinearity. Let's discuss what kind of issues can occur because of multicollinearity-
Checking MulticollinearityThe two methods of checking the multicollinearity are-
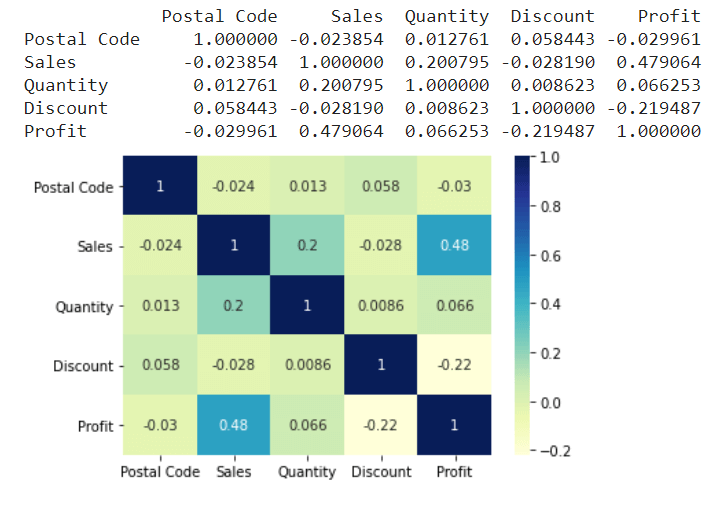
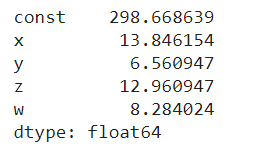
Plotting a heatmap to comprehend the correlationTaking a dataset, and plotting a heatmap will help us to infer which attribute has the most significant value of correlation. This value will tell us the extent of influence between the dependent variable and the independent variable. Let us have a look at a program that shows how it can be implemented. Example - Output:  Use Variance Inflation FactorThe Variance Inflation Factor is the measure of multicollinearity that exists in the set of variables that are involved in multiple regressions. Generally, the vif value above 10 indicates that there is a high correlation with the other independent variables. Let us have a look at a program that shows how it can be implemented. Example - Output:  Different ways to resolve the issue of Multicollinearity-
The variables should be selected in a way that the ones which are highly correlated are removed and we make use of only the significant variables.
Transformation of variables is an integral step and here the motive is to maintain the feature but performing a transformation can give us a range that won't produce a biased result.
Principal Component Analysis is dimensionality reductions technique through which we can obtain the significant features of a dataset that strongly influence our target variable. One thing that we must take care of while implementing PCA is that we should not lose the essential features and try to reduce them in a way that we gather the maximum possible information. Next Topic__add__ Method in Python |

We provides tutorials and interview questions of all technology like java tutorial, android, java frameworks
G-13, 2nd Floor, Sec-3, Noida, UP, 201301, India


