Scatter() plot pandas in PythonA data visualization method that displays the relationship between two numerical variables is called a scatter plot. In Python, there is a class named DataFrame that can be used to plot to scatter plots using pandas, and this class's member is called plot. By using the scatter() function on the plot component, a pandas DataFrame plot is drawn between two variables or two columns. Utilizing a Pandas DataFrame for a scatter plot
SyntaxHere, the syntax shows how to write code for the scatter() method: The following are the syntax parameters for the scatter() method:
ExamplesHere are various examples of scatter plots of pandas with different parameters. We can see the many scatter plots with a given size, color, and other functions. Example1: the following example shows a scatter plot using the pandas. We can see the plot values in the x and y-axis position with essential tuples. Output The following image shows a scatter plot of the pandas. 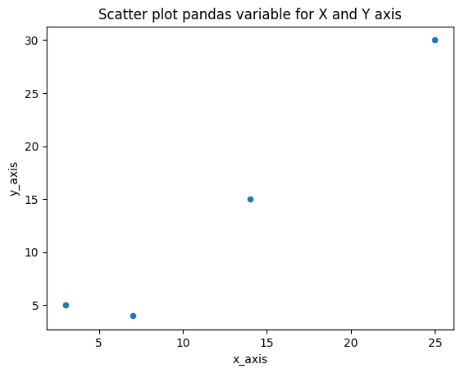 Example2: the following example shows a scatter plot using the pandas dataframe. Here, we use string and numerical values for scatter plots. Output The following image shows a scatter plot with value in Python. 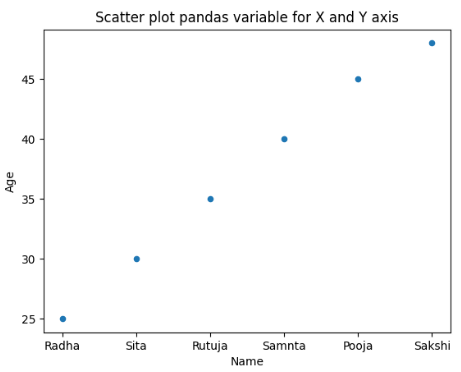 Example3: the following example shows a scatter plot using Python. Here, we use color to the tuple of the scatter plot. Output The following image shows a scatter plot with value in Python. 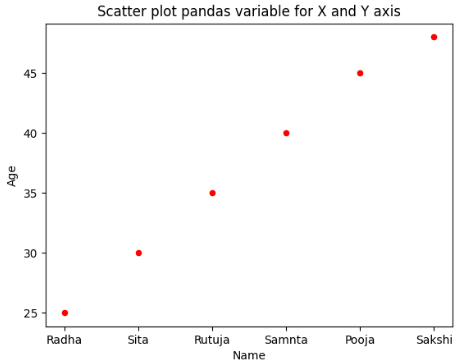 Example4: the following example shows a scatter plot using Python. Here, we use the required size of the tuple of the scatter plot. Output The following image shows a scatter plot with value in Python. 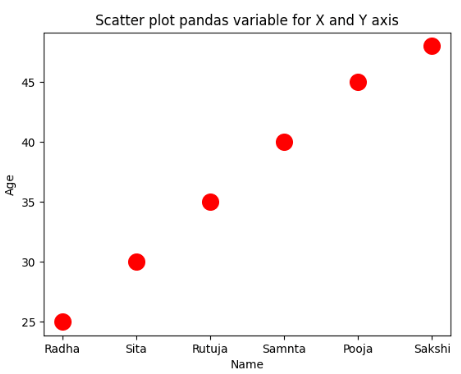 Example5: the following example shows a scatter plot using Python. Here, we use the required size of the tuple of the scatter plot with edge color. Output The following image shows a scatter plot with value in Python. 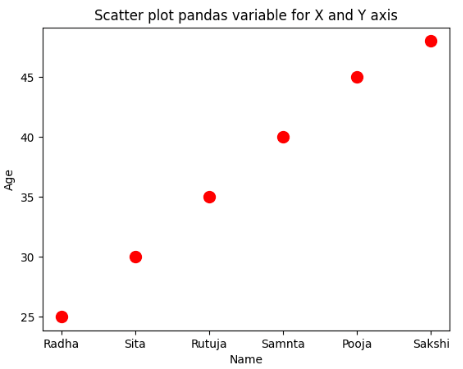 Example6: the following example shows a scatter plot using Python. Here, we use the required size of the tuple of the scatter plot with edge color and line width. Output The following image shows a scatter plot with value in Python. 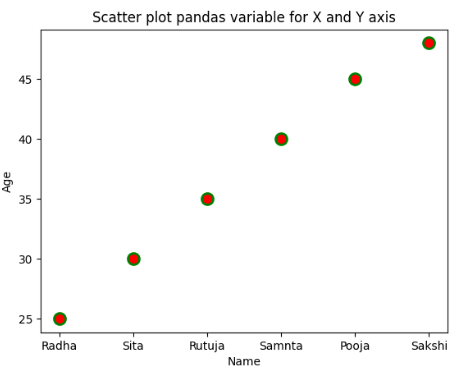 Example7: the following example shows a scatter plot using Python. Here, we use the required size of the tuple of the scatter plot with a different color. Output The following image shows a scatter plot with value in Python. 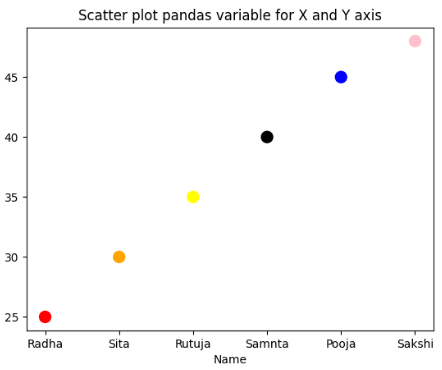 Example8: the following example shows a scatter plot using Python. Here, we use the required size of the tuple of the scatter plot with different colors and sizes Output The following image shows a scatter plot with value in Python. 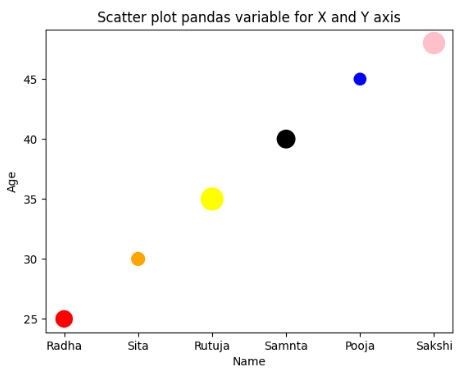 Example9: the following example shows a scatter plot using Python. Here, we use two bar-type scatter plots in different colors for comparison purposes. Output The following image shows a scatter plot with value in Python. 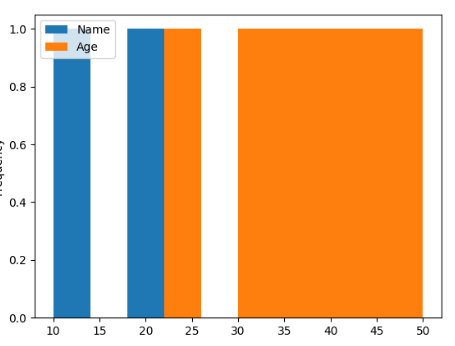 ConclusionThe scatter plot in pandas shows multiple types of graphs using python language. Here, we can create, display, and compare large-size data on a single page. It is a user-friendly, easy, simple, and sorted method to display data using scatter plots in Pandas. Next TopicScatter() plot matplotlib in Python |

We provides tutorials and interview questions of all technology like java tutorial, android, java frameworks
G-13, 2nd Floor, Sec-3, Noida, UP, 201301, India


