Python seaborn LibrarySeaborn is one of an amazing library for visualization of the graphical statistical plotting in Python. Seaborn provides many color palettes and defaults beautiful styles to make the creation of many statistical plots in Python more attractive. Objective of Python Seaborn librarySeaborn library aims to make a more attractive visualization of the central part of understanding and exploring data. It is built on the core of the matplotlib library and also provides dataset-oriented APIs. Seaborn is also closely integrated with the Panda's data structures, and with this, we can easily jump between the various different visual representations for a given variable to better understand the provided dataset. Categories of Plots in Python's seaborn libraryPlots are generally used to make visualization of the relationships between the given variables. These variables can either be a category like a group, division, or class or can be completely numerical variables. There are various different categories of plots that we can create using the seaborn library. In the seaborn library, the plot that we create is divided into the following various categories:
Installation of seaborn library for PythonHere, we will learn how we can install the seaborn library for Python. After installing the seaborn library, we can import it into our Python program and use it in Python. Required dependencies or prerequisites for the seaborn library: We must have,
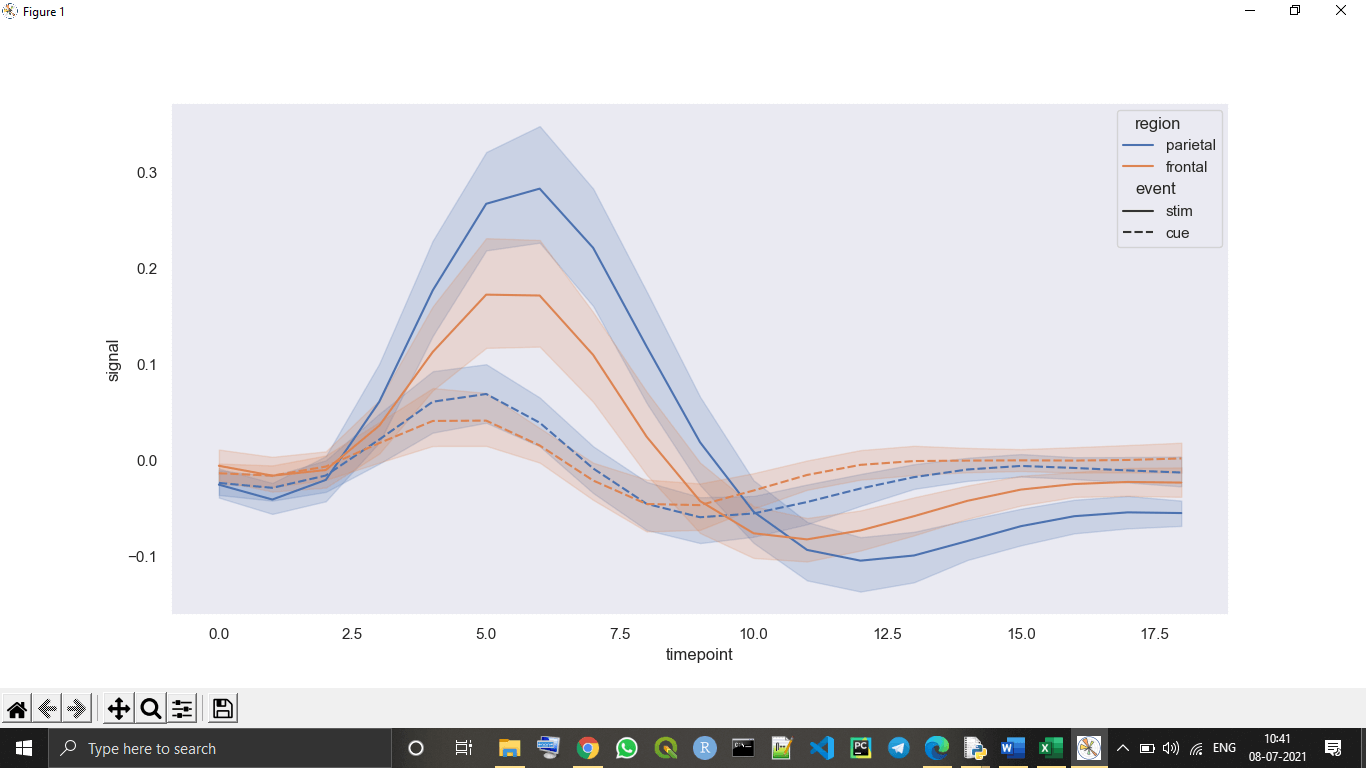
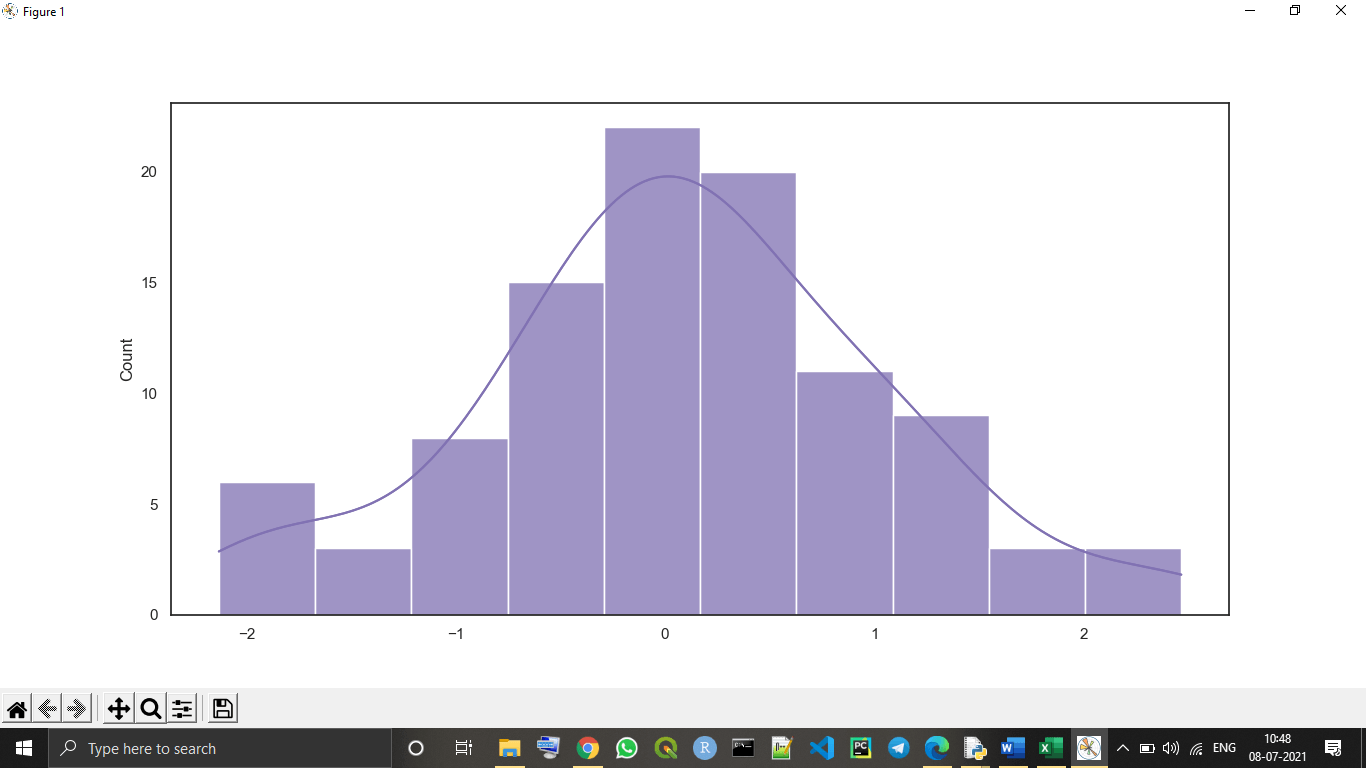
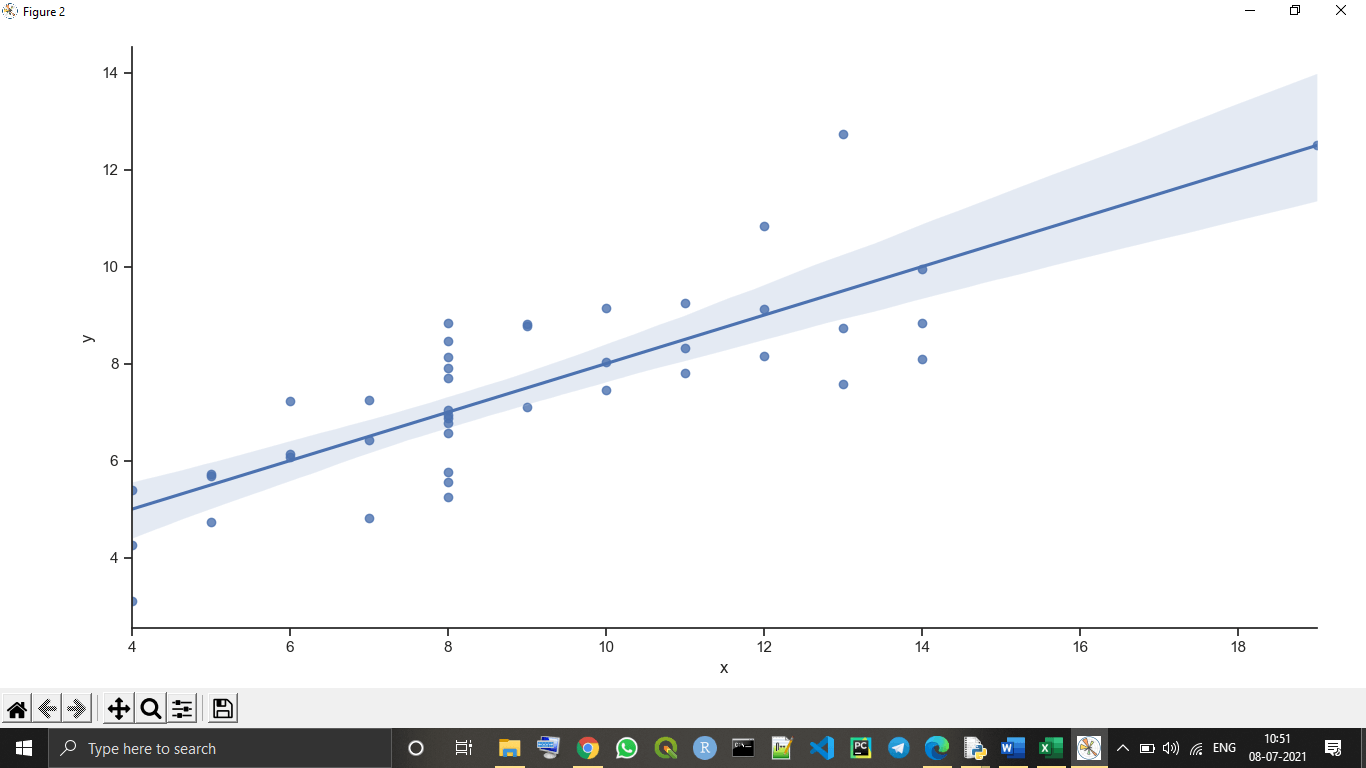
Now, we will learn about some basic plots examples that we can plot in Python using the seaborn library. Plotting Chart Using seaborn Library1. Line plot:The seaborn line plot is one of the most basic plots presents in the seaborn library. We use the seaborn line plot mainly to visualize the given data in some time-series form, i.e., in a continuous manner with respect to time. Example - Output:  Explanation: In the above code, after setting the dataset as fmri type and setting style of a line plot, we use the lineplot() function to draw the line plot in the output. 2. Dist plot:We use the seaborn dist plots to plot histograms with the given variables and data as a result. We can plot histograms with some other variations such as rugplot and kdeplot using a dist plot. Example - Output:  3. Lmplot:The Lmplot is another one of the basic plots in the seaborn library. The Lmplot shows a line that represents a linear regression model with the data points on the given two-dimensional (2-D) space. In this 2-D space, we can set x and y variables as the vertical and horizontal labels, respectively. Example - Output: <seaborn.axisgrid.FacetGrid object at 0x000002182DC89070>  Next TopicCountplot in Python |

We provides tutorials and interview questions of all technology like java tutorial, android, java frameworks
G-13, 2nd Floor, Sec-3, Noida, UP, 201301, India


