Principal Component Analysis (PCA) with PythonPrincipal Component Analysis (PCA): is an algebraic technique for converting a set of observations of possibly correlated variables into the set of values of liner uncorrelated variables. All principal components are chosen to describe most of the available variance in the variable, and all principal components are orthogonal to each other. In all the sets of the principal component first principal component will always have the maximum variance. Different Uses of Principal Component Analysis:
Principal component analysations are usually executed on a square symmetric matrix, and this can be a pure sum of squares and cross products matrix or correlation matrix or covariance matrix. The correlation matrix is used if there is a major difference in the individual variance. What are the Objectives of Principal Component Analysis?The basic objectives of PCA are as follows:
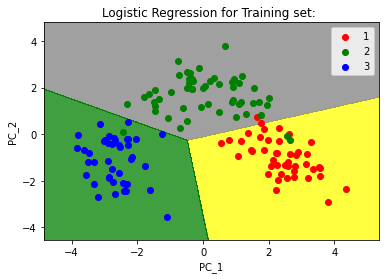
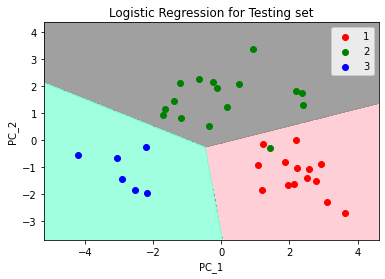
Principal Axis Method: Principal Component Analysis searches for the linear combination of the variable for extracting maximum variance from the variables. Once the PCA is done with the process, it will move forward to another linear combination which will explain the maximum ratio of the remaining variance, which would lead to orthogonal factors of the sets. This method is used for analysing total variance in the variables of the set. Eigen Vector: It is a nonzero vector that remains parallel after multiplying the matrix. Suppose 'V' is an eigen vector of dimension R of matrix K with dimension R * R. If KV and V are parallel. Then the user has to solve KV = PV where both V and P are unknown for solving eigen vector and eigen value. Eigen Value: It is also known as "characteristic roots" in PCA. This is used for measuring the variance in all the variables of the set, which is reported for by that factor. The proportion of eigen value is the ratio of descriptive importance of the factors concerning the variables. If the factor is low, then it subsidises less to the description of variables. Now, we will Discuss Principal Component Analysis with Python. Following are the Steps for Using PCA with Python:In this tutorial, we will use wine.csv Dataset. Step 1: We will import the libraries. Step 2: We will import the dataset (wine.csv) First, we will import the dataset and distribute it into X and Y components for data analysis. Step 3: In this step, we will split the dataset into the training set and testing set. Step 4: Now, we will Feature Scaling. In this step, we will do the re-processing on the training and testing set, for example, fitting the standard scale. Step 5: Then, Apply the PCA function We will apply the PCA function into the training set and testing set for analysis. Step 6: Now, we will fit Logistic Regression for the training set Output: LogisticRegression(random_state=0) Step 7: Here, we will predict the testing set result: Step 8: We will create the confusion matrix. Step 9: Then, predict the result of the training set. Output:  Step 10: At last, we will visualize the result of the testing set. Output:  ConclusionIn this tutorial, we have learned about principal component analysis with Python, its uses, and objects and how to use it on the data set to analyse the data's testing and training sets. |

We provides tutorials and interview questions of all technology like java tutorial, android, java frameworks
G-13, 2nd Floor, Sec-3, Noida, UP, 201301, India


