IPython DisplayIPython means interactive Python. It is an interactive command-line terminal for Python. It will provide an IPython terminal and web-based (Notebook) platform for Python computing. It has more advanced features than the Python standard interpreter and will quickly execute a single line of Python code. Python and IPython are two names that are similar but entirely different. PythonPython is a popular programming language. Guido Van Rossum created and released it in 1991 at CWI (Centrum Wiskunde& Informatica) Netherlands. Python is a general-purpose, high-level programming language, and also Python is dynamic. Python is simple and easy to learn, it is platform-independent, and also it is free and open source. It has rich liberty support, and also it is embeddable and extensible. Python libraries include Numpy, Scipy, pandas, and matplotlib. We can use Python very quickly, and it is dynamic, making it a productive language. IPythonIPython is an interactive command-line terminal for Python. Fernando Perez created it in the year 2001. It will offer an enhanced read-eval-print loop (REPL) environment and is particularly well adapted to Scientific Computing. IPython is a powerful interface to the Python language. Apart from Python, the most common way to use Python is to write scripts and files with the ".py" extension. A script contains a list of commands to execute in order, and it will run from start to finish and display some output. In other words, with IPython, we write one command at a time and get the results quickly. It is an entirely different way of working with Python. When analyzing data or running computational models, we need this interactivity to explore them efficiently. Jupyter NotebookIn 2011, IPthon introduced a new tool called "Notebook". Mathematica or Sage inspired the Notebook; it will offer Python a modern and powerful web interface. Comparing it with the original IPython terminal, the Notebook will offer a more convenient text editor and the possibility to write rich text with improved graphical capabilities. Since it is a web interface, it will integrate many existing web libraries for data visualization, including plotly.js. In 2015, the Ipython developers made a significant code reorganization of their project. So, the Notebook is now called the Jupyter Notebook. So, this interface is used with Python and many languages like R and Julia. IPyhton is the name of the Python backend. Ipython and Jupyter are both great interfaces to the Python language. If we are learning Python, using the IPython terminal or Jupyter Notebook is highly recommended. InstallationIPython will provide a rich architecture for interactive Computing with the following:
Jupyter and the Future of IPythonIPyhton is a growing project with increasing language components. IPython 3.x was the last monolithic release of IPython, containing the notebook server, qtconsole, etc. As for the IPython 4.0, the language-agnostic parts of the project: the notebook format, message protocol, qtconsole, notebook web application, etc. It has moved to new projects under the name Jupyter. IPython itself is focused on interactive Python, part of which is providing a Python kernel for Jupyter. Features of IPython
History and DevelopmentFernando Perez developed IPyhton in the year 2001. The present version of IPython is IPython 1.0.1, which will require Python 3.4 version or higher. IPython 6.0 was the first version to support Python 3. Users having Python 2.7 should work with IPython's version 2.0 to 5.7. How to Display Rich Media Content (Image, Audio, Video, etc.) in Jupyter Notebook?Jupyter notebook and Lab have become favorite tools for data scientists and developers worldwide for performing data analysis and related tasks. Jupyter Notebooks are famous because it is user-friendly interface and out-of-box functionalities supporting shell commands from the notebook. They make them a unique and go-to tool in the data science community. The Jupyter notebook is based on the IPython kernel, which runs under the hood. IPython kernel is like a standard Python interpreter but with many additional functionalities. Most data scientists worldwide use the Jupyter Notebook, which will support displaying rich media content like images, markdowns, latex, video, audio, HTML, etc. It frees users from the hassle of using different tools to see contents of many types. We can play audio as well as video in a notebook that is displayed. When we include static and interactive charts in notebooks created during analysis, we can even develop " voila " dashboards. All pieces of analysis are available in only one place, which does reproducible research that is easy to conduct. It is helpful for presentations as many people use Jupyter Notebooks for presentations. So, the above benefits will make Jupyter notebooks the most preferred tool by data scientists worldwide. How do we Display Rich Media Content in Notebooks?The IPython kernel that powers Jupyter notebook has a module named "display", which will provide us with a list of classes and methods used for displaying rich media contents of different types in Jupyter notebook and Jupyter lab. What can we learn from this IPython?We have seen how to display Rich media contents/outputs in Jupyter Notebook. It will include audio/sound, video, latex, markdown, HTML, iframe, SVG, pdf, etc. The functions and classes for displaying rich outputs are available through "IPython.display" we have listed in the above section. Important Classes and Functions of the "Ipython.display" ModuleThere is a list of classes and methods available with the IPython.displaymodule. Classes The classes displayed below will accept the data of a particular type and, when executed from the Jupyter notebook cell, will display the content of that type in a notebook.
Functions The "display_*()" functions will take input as many objects created using the classes mentioned above and display them sequentially. According to their name, the method will take objects of one kind as input except for the last display() method, which will combine contents of different types and display them.
It will end small introduction and now let us start with the coding part. We will start by importing the display module. How to Display the "Audio" or "Sound" Player in Jupyter Notebook?The class "Audio" will display audio files in a jupyter notebook and provide a simple player to pause/play to listen to the audio. The first argument of the method is "data" that will accept one of the below inputs and generate an Audio object which, when displayed, will display a small player that can play audio.
Below we have given as input URL of an audio file, and it will display an audio object that will play that audio. We have also discussed examples of playing audio from local files below. We can also set the autoplay parameter named rate, which specifies the sampling rate and should be used if data is provided as a numpy array or list of floats. When we give an object created by any class as the last line in the notebook cell, it will display an object of that type. We need to make sure that make note that the majority of classes available from the display module will provide a Boolean parameter named embed, which puts the DATA URI of the content into a notebook, and next time, we won't need to load that content into the notebook from file/URL. How to Display "Code" in Jupyter Notebook?The code class is used to display code in syntax-highlighted format. We can also provide code information to the class in one of the below-mentioned ways.
How to Display the File as a Downloadable Link using "FileLink" in Jupyter Notebook?The FileLink class will create links around the files locally. It will accept a file name as input and make a link surrounded by it. We can also give prefixes and suffixes to use around links using result_html_prefixand result_html_suffix commands. We have also discussed the usage of the class below with small examples. It can be helpful when we run a notebook on platforms like Kaggle, google collab, or any other platform that will not provide access to local disks for downloading files generated at the time of our analysis as plotting files, wights files, etc. How to Display all Files in the directory as downloadable links using "FileLinks" in Jupyter Notebook?The class "FileLinks" will work the same as the FileLink class; the only difference is that it accepts directory names as input and creates a list of links for all the files. There are usages which are of the temporary folder named sample_filesthat are created for this. It will provide a boolean parameter named recursive that is True by default and also recurses in all subdirectories to display files in all of them. We can also set this parameter to False if we do not want links to subdirectories. How to Display "HTML" in Jupyter Notebook?The class named "HTML" display an HTML notebook. The class will accept a list of the below-mentioned data types as input for creating an HTML page.
Basic Principles of Information VisualizationWe will discuss the simple principles of data visualization that we have collected and analyzed. We will discuss various principles to keep in mind when we form a visualization that will make sense to the human brain. Our primary focus is to learn how to help present data, which is helpful for the human brain and can be very easily interpreted without training. Visualization of dataData visualization is mainly divided into three categories. They are: Information visualization It will refer to abstract information that will not have a position in space like a line chart representing stock price over many years. Example: Static plots using matplotlib, seaborn, etc. Scientific visualization It mainly refers to representing the data with a physical representation in space, like sonography reports, methane distribution in a combustion engine, CT scan reports, and MRI scan reports where every data point has an actual 3D location in space. Visual analytics It refers to interactive dashboards, visualization, and statistical algorithms that can quickly analyze from different aspects. Example: Dashboards using a dash, plotly, voila, panel, etc. display_html()The display_html() method will take a list of objects created using the display.HTML class as input and display all of them one by one in Jupyter notebook. The code below will explain the usage with a simple example where we combine the HTML of the google URL and the local file. Output 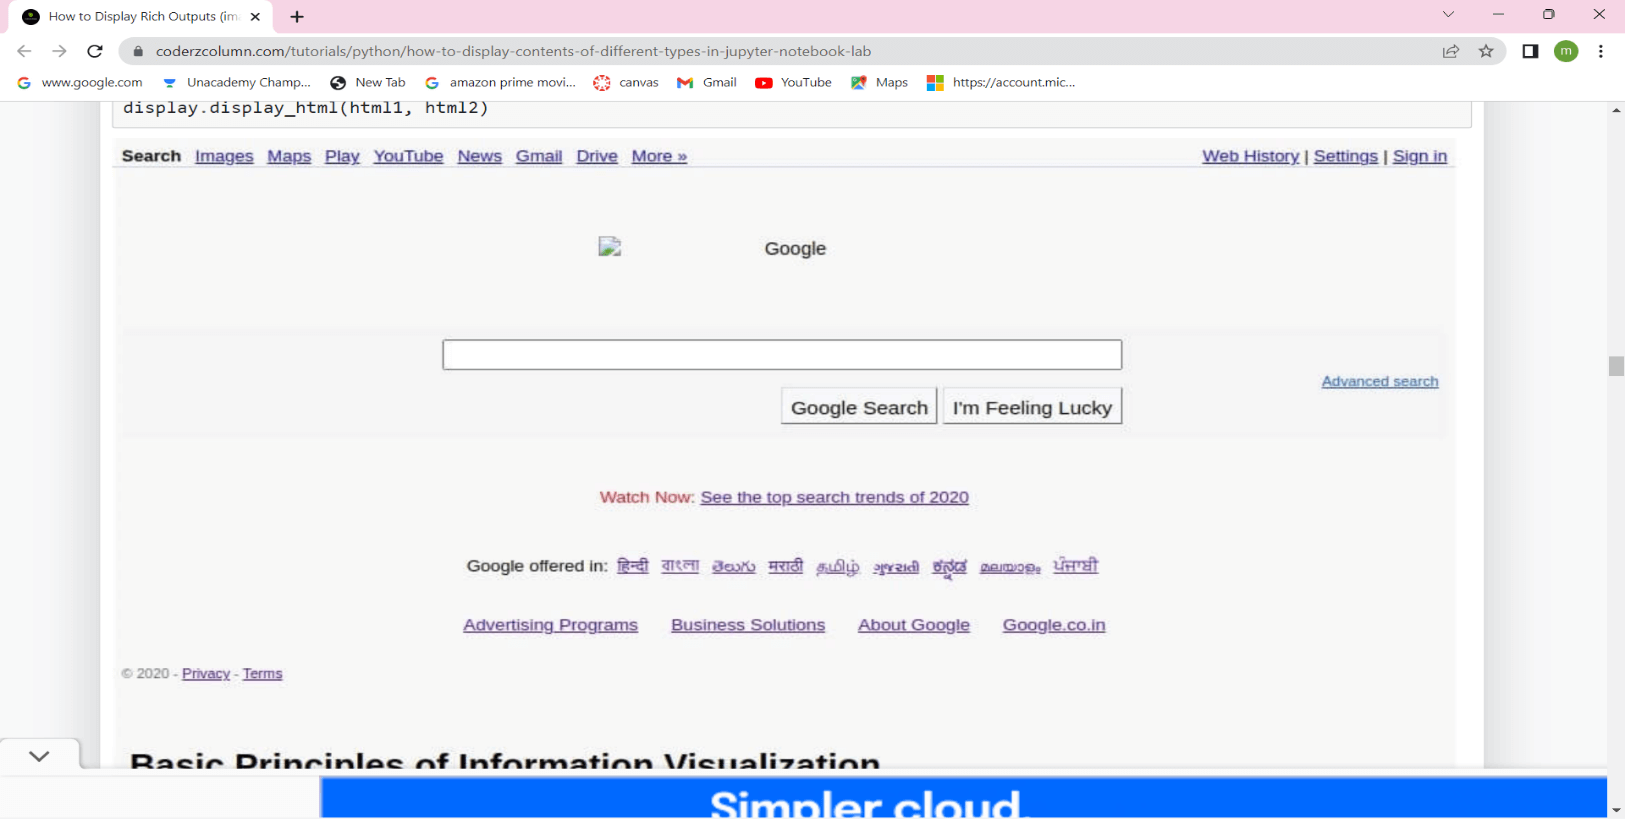 How to Display "IFrame" in Jupyter Notebook?The IFrame class will display iframes in Jupyter notebooks, and it will let us specify the width and height of the IFrame. We need to use an IFrame for displaying local HTML files and IPython documents using URLs. How to Display "Images" in Jupyter Notebook?The class "Image" will display images of type jpg/jpeg/png/gif in Jupyter Notebook. We can also give either image information as str/bytes or filename/URL.
How to display "SVG Images" in Jupyter Notebook?The class called SVG will display the SVG images in the Jupyter notebook. We can also provide the Image's file name on a local system or web URL for displaying the SVG Image.
How to display "JSON" in Jupyter Notebook?The class JSON will display the contents of the JSON as a directory-like structure in Jupyter Notebook itself, where we can find it by expanding or removing the structure with the node. The input is a JSON dictionary to the method, and it will display the contents in a tree-like interactive structure. The class will load JSON from the local files and URLs within the web. This functionality will only work with Jupyter lab. It will not work for Jupyter notebook. Output 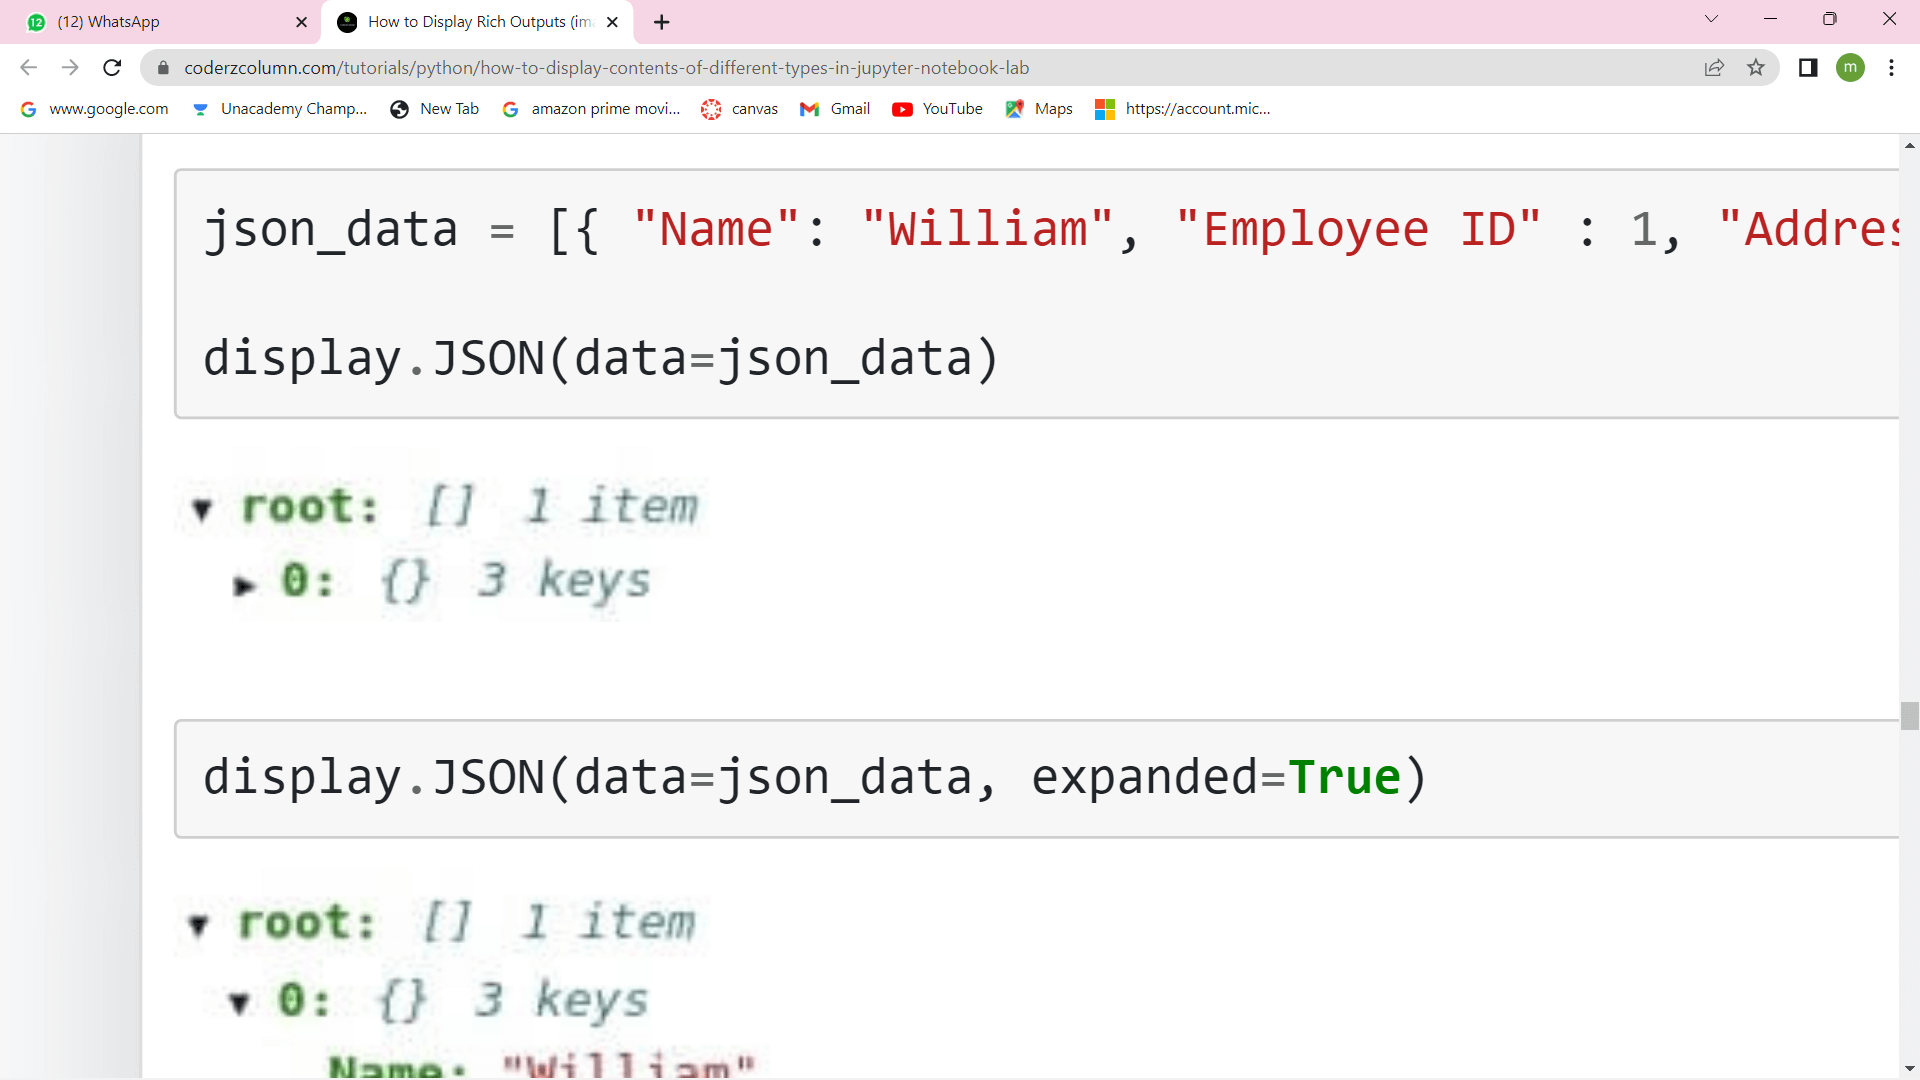 Output 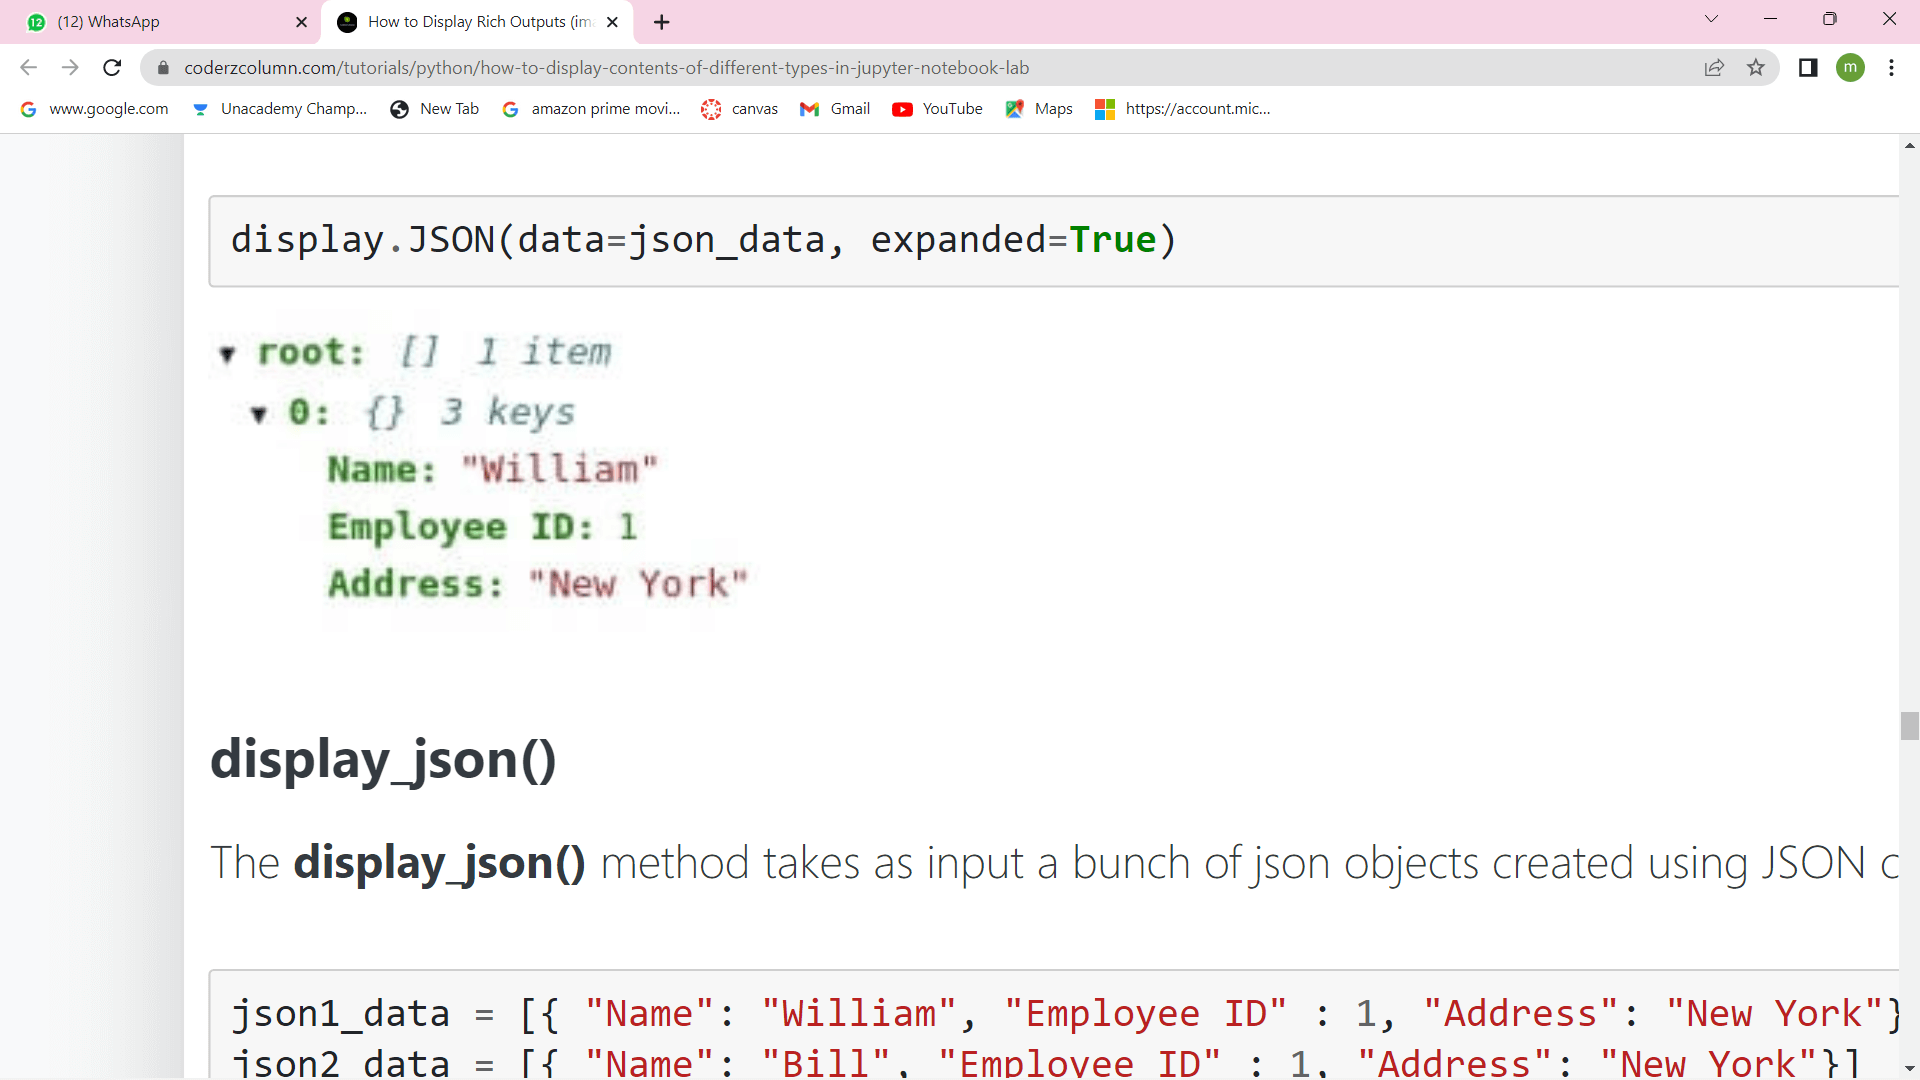 display_json() The method display_json() will take input as a group of json objects created using JSON class and display all of them one by one. Output 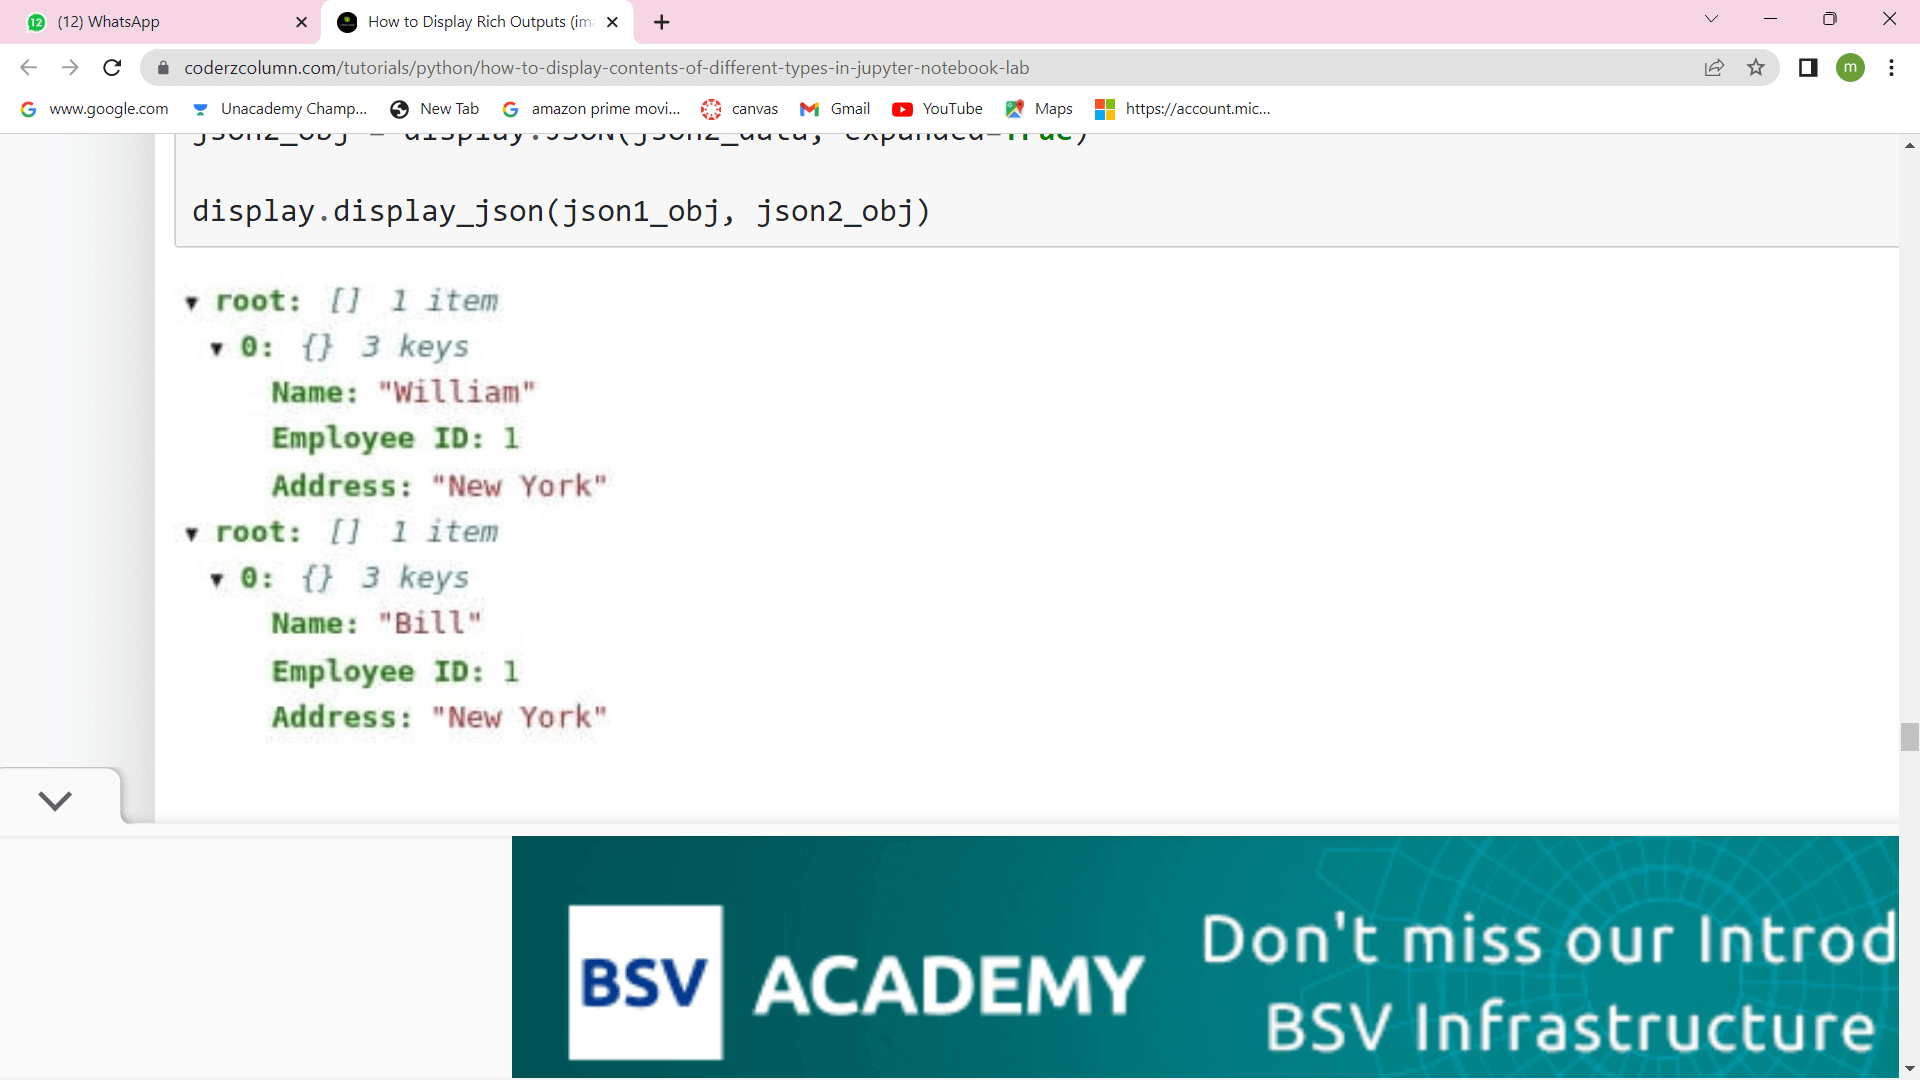 How to display "Javascript" in Jupyter Notebook?The class named Javascript will execute javascript code in Jupyter Notebook. We can also provide the file name or URL of the javascript code, and it will execute them. We can also access the HTML element of cell output by using the element variable in javascript. It will also modify it according to our need to display the notebook output. From below, we have executed a simple javascript code which will compare three numbers and print the largest of three numbers as the output of the cell by setting the innerHTML attribute of the element. We need to make this functionality will only work with Jupyter lab, and it will not work in a Jupyter notebook. Example Output The Largest Number is: 35 How to display "Markdown" in Jupyter Notebook?The class named Markdown will display in the Jupyter notebook. The Jupyter notebook will provide markdown cells already where we can display markdowns, but this class will be helpful when we get markdown data from many sources in code. Below, we can explain that with a simple example of how we can use it. The class will also load Markdown from a local file or web URL. Example Output 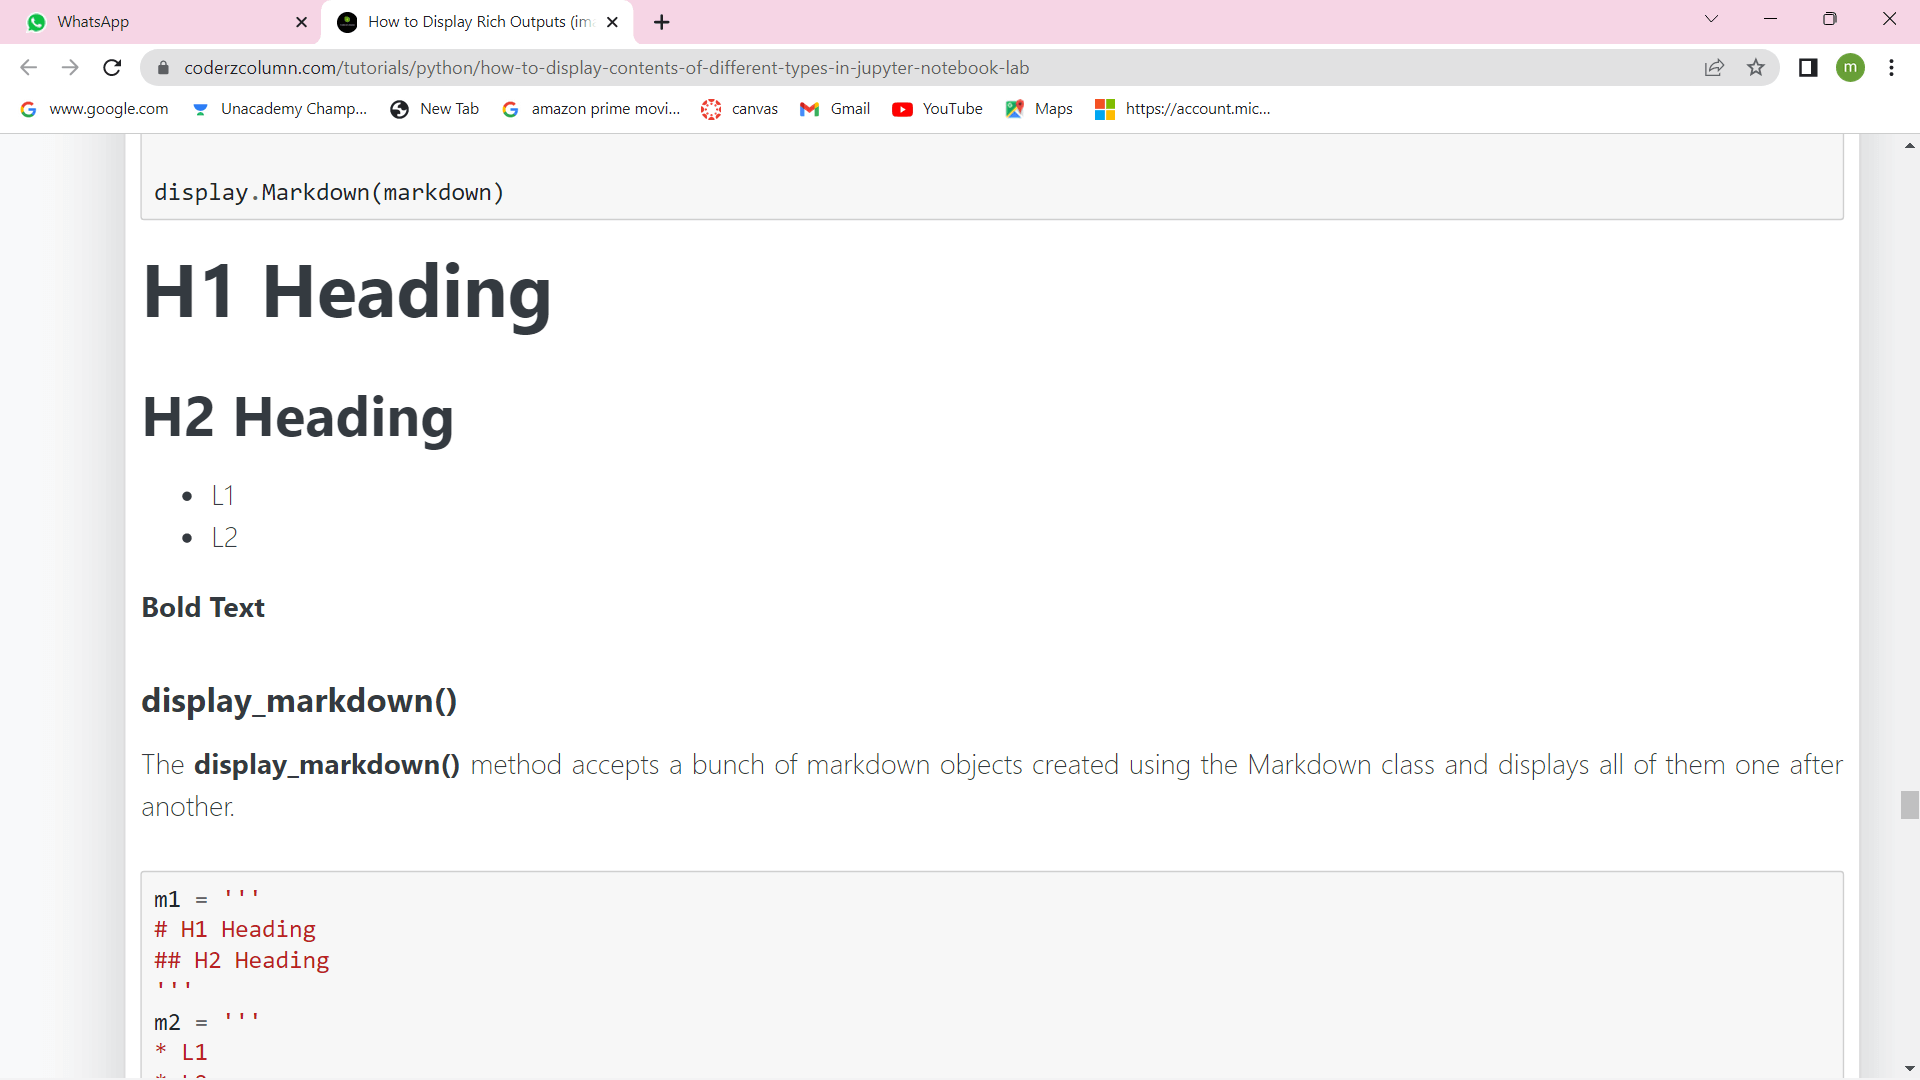 display_markdown()The method display_markdown() will accept a group of markdown objects created using the Markdown class and display all of them one by one. How to Display Mathematical Formulas using "LaTex" in Jupyter Notebook?Latex's class will display Latex in a Jupyter notebook, generally used for expressing mathematical formulas in a Jupyter notebook. The Jupyter notebook will use math jaxjavascript for displaying Latex in Jupyter notebook. We can also provide latex data as a string, file name, or URL on the web to class. We also explained it with an example of displaying a formula in a Jupyter Notebook that will be a requirement of many scientific projects. Output 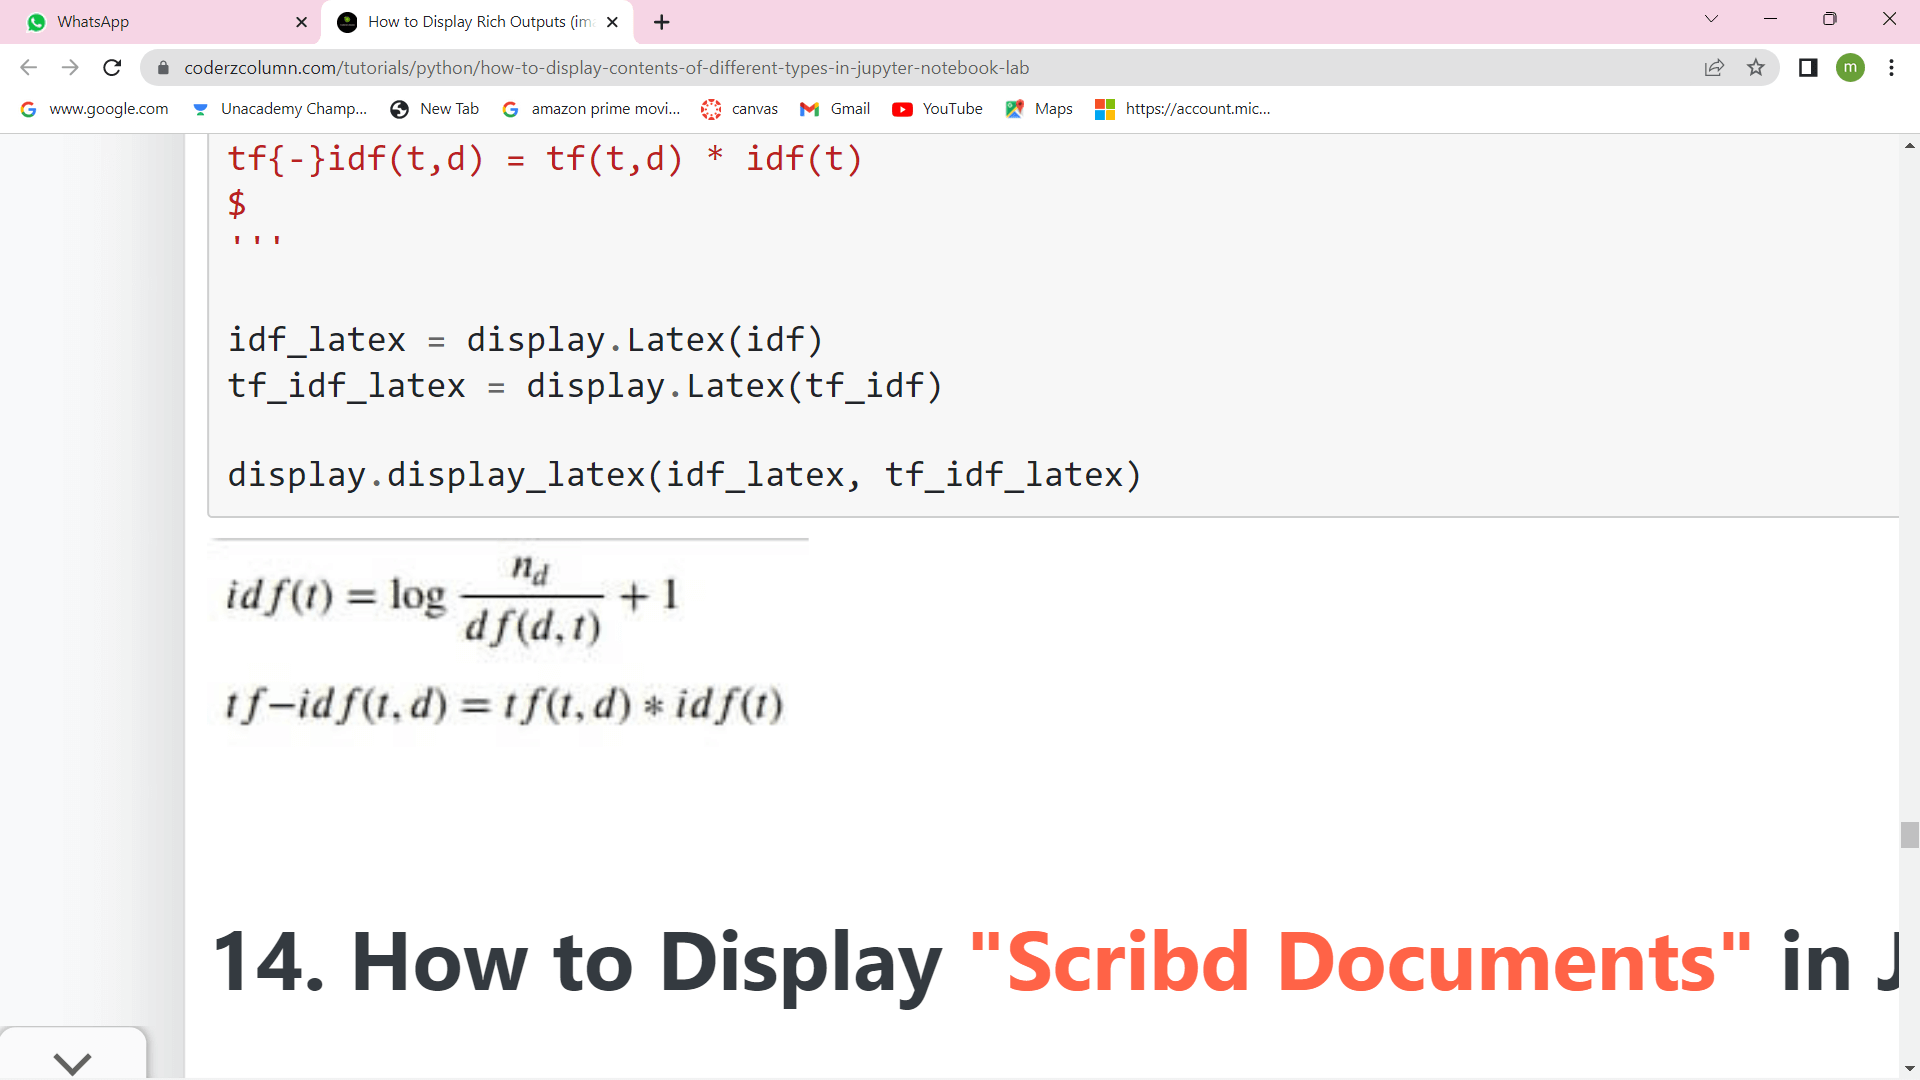 display_latex()The display_latex() will take input as a list of Latex objects and display Latex individually. Output 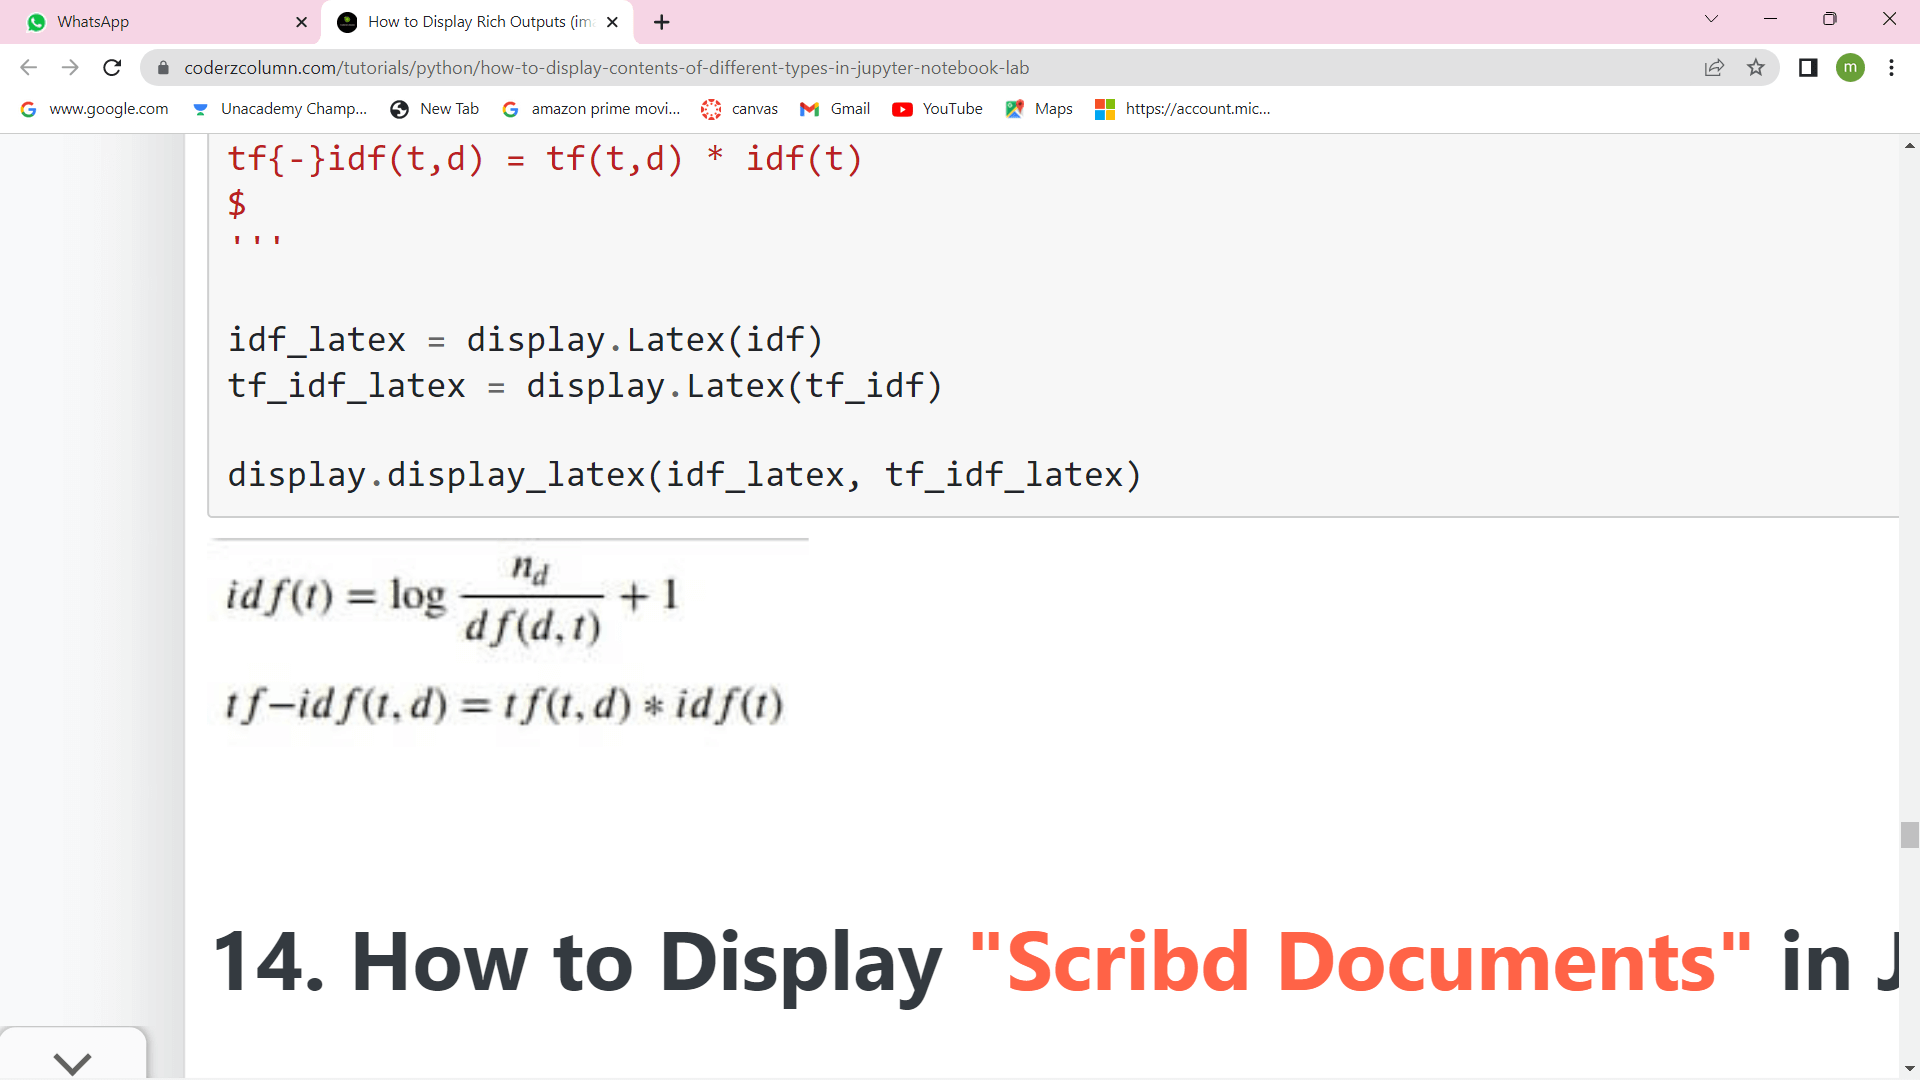 How to display "Scribd Documents" in Jupyter Notebook?The class named ScribdDocument will display Scribd pdf files in a Jupyter notebook. We have to provide the unique id of the book on Scribd, which will display a document in a notebook that we can then read. We can also specify the height and width of the frame that will display the book. It will also specify the starting page number by using the start_page parameter to start from that page. Next TopicJoint Plot in Python |